Graphviz on Ubuntu 24.04 or any other Linux is used to visualize graphs. It is an open-source tool that generates graphs using the DOT language. Developers, data scientists, and network engineers use it to create diagrams and visualizations.
The great thing about this tool is that users can use Graphiviz to generate visual representations by describing graphs in simple text. It supports a variety of graph styles and formats, including directed and undirected graphs. It is commonly used for visualizing relationships in software engineering, bioinformatics, machine learning, and network topology.
Installing Graphviz on Ubuntu 24.04
1. Update Linux Package List:
On Ubuntu 24.04 Linux, open the command terminal and execute the system update command to refresh the repository package listing and install available updates.
sudo apt update && sudo apt upgrade -y2. Install Graphviz on Ubuntu 24.04:
The packages to get Graphviz on Ubuntu are relatively easy because they are available to install from the default system repository of Ubuntu 24.04. Therefore, on your terminal, execute the given command syntax to install Graphviz along with the required dependencies:
sudo apt install graphviz3. Verify the Installation:
Once you have completed the previous step, we can use the ‘dot‘ command line to confirm the version of Graphviz installed on our Ubuntu 24.04, which will also confirm that the tool is on the system without any errors.
dot -VYou should see an output similar to:
dot - graphviz version x.x.x
Basic Usage of Graphviz
Now that we have installed the tool, it’s time to learn how to use the dot command-line utility to generate a visual representation of a graph. The data to create graphs will be in a plain text file with the .dot extension.
Create a DOT file
Create a new file, let’s name it – “demo.dot” and then add the content given in this step to define a simple directed graph:
nano demo.dotAdd the given content:
digraph G {
    A -> B;
    B -> C;
    C -> A;
    A -> D;
}
To save the file, we can press Ctrl+X, Y, and Enter Key to exit.
Generate a Graph Image:
After saving the file with data telling Graphviz what to represent in the graph, we can now use the dot command to generate an image from the DOT file.
dot -Tpng demo.dot -o demo-graph.pngThe -T option specifies the output format (e.g., PNG), and the –o option specifies the output file. In the above command, “demo.dot” is the file we created with data for the graph, while the “demo-graph.png” file is used to save the created graph image.
Open the Generated Image:
Once you have executed the command and generated the PNG file. You can use the Ubuntu GUI file manager and navigate to the file to open it by just clicking. Alternatively, we can use the command line to call image viewer eog (Eye of GNOME) to open the generated PNG file:
eog demo-graph.png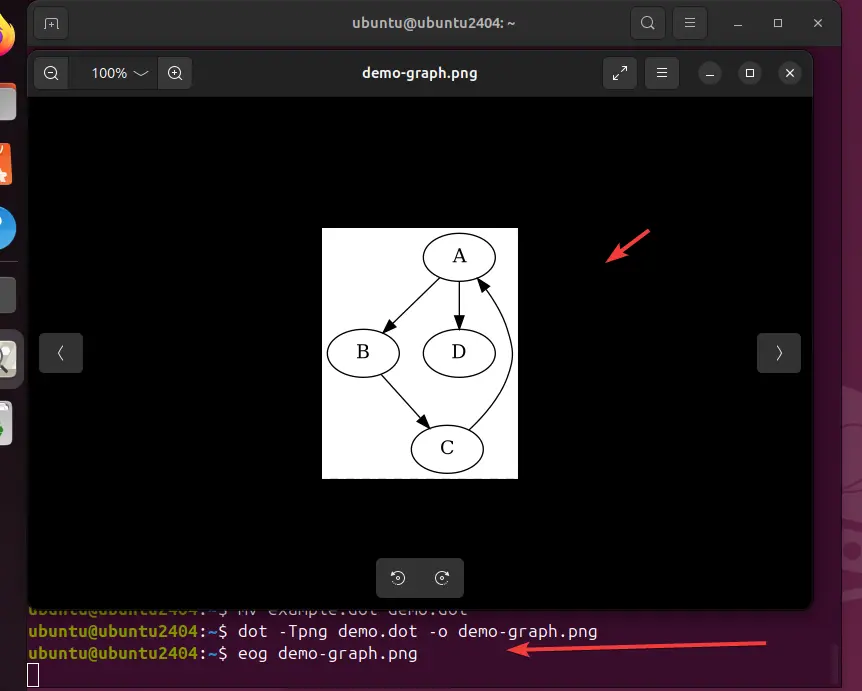
Generating Graphs in other formats
PNG is not the only format supported by Graphviz. Instead, we use other supported output formats such as JPG, PDF, SVG, etc. We just need to specify the desired format using the -T option:
Examples:
Generate a PDF:
dot -Tpdf demo.dot -o demo-graph.pdfGenerate an SVG:
dot -Tsvg demo.dot -o demo-graph.svgGenerate a JPEG:
dot -Tjpg demo.dot -o demo-graph.jpgTIP:
We can also generate graphs directly from the command line without creating a .dot file:
echo "digraph G { A -> B; B -> C; C -> A; }" | dot -Tpng -o output.pngFor more details on how to use Graphviz, check out the official documentation of this tool.
Other Articles:
- How to Install Python Dependencies in Ubuntu Linux
- Installing balenaEtcher on Ubuntu 24.04 to create bootable drives
- How to install Bitwarden server on Ubuntu 24.04 | 22.04 LTS via Docker
- Install and Use Bitwarden Client on Ubuntu 24.04 LTS Linux
- How to install OwnCloud in Ubuntu 24.04 LTS Noble Server Linux