Learn the commands to install open source Grafana on AlmaLinux or Rocky Linux to visualize data in dynamic and interactive dashboards.
What is Grafana?
In simple words, Grafana is a free and open-source software used by developers and administrators to visualize data generated by different sources in an interactive & dynamic dashboard. The programming language used to code it is Go and TypeScript. With the help of plugins, it allows query, visualize, monitoring, alert on and understand metrics from various data sources such as Google sheets, Amazon Timestream, Cloudera Manager, Elastic Search, etc. including popular time-series databases such as InfluxDB, Prometheus, or Graphite and also supports MySQL, PostgreSQL, and other relational databases.
The software is available for different platforms and operating systems such as Linux (Debian, Ubuntu, CentOS, Fedora, OpenSUSE, Red Hat, and others), macOS, and Windows or as a Docker image. The data can be displayed in many different chart and graph types. Alerting based on the data is also supported.
Apart from the Open source edition, the developer company behind Grafana also offers paid cloud and enterprise versions.
Steps to install Grafana on AlmaLinux or Rocky 8 Server
The steps and commands given here are also applicable for other RPM-based Linux distros such as CentOS, Fedora, OpenSuse, and Red Hat.
Step 1: Add Grafana RPM Repository
Although, we can install Grafana by directly downloading its binary from its official website, however, adding a repo will be a good idea for updates.
Copy the whole block of command given below and paste it into your AlmaLinux or Rocky command terminal. After that press the Enter key and provide your user password to create the Grafana repo on the system.
sudo tee /etc/yum.repos.d/grafana.repo<<EOF

[grafana]
name=grafana
baseurl=https://packages.grafana.com/oss/rpm
repo_gpgcheck=1
enabled=1
gpgcheck=1
gpgkey=https://packages.grafana.com/gpg.key
sslverify=1
sslcacert=/etc/pki/tls/certs/ca-bundle.crt

EOF

Step 2: Run system update
To install the latest updates available for the system and also to refresh your Linux repos, run the DNF update command-
sudo dnf update -y
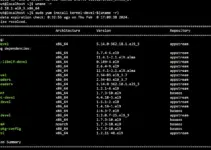
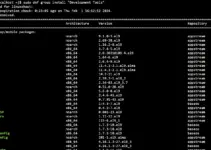
Step 3: Command to install Grafana on AlmaLinux or Rocky Linux
That’s it we don’t need to do anything else to install this open-source monitoring platform on your RPM-based Linux server systems. Simply run
sudo dnf install grafana

Step 4: Start and Enable Grafan system service
As we have already done with the installation, now it’s time to start the service of this monitoring dashboard, and also make it enable so that it can start automatically with system boot.
sudo systemctl start grafana-server
sudo systemctl enable grafana-server
Step 6: Allow Grafana port in the Almalinux or rocky firewall
You can access the Grafana Dashboard on the local machine using its browser without any problem, however, if you are using a CLI server then definitely want to use some other computer browser. Thus, to remotely access the monitoring web-based dashboard, we have to whitelist port number 3000 in our firewall.
sudo firewall-cmd --add-port=3000/tcp --permanent
sudo firewall-cmd --reload
To change the port number
Note: If you want to use a custom port with it then edit its config file- sudo nano /usr/share/grafana/conf/defaults.ini and there change the http_port = 3000 value.
if 3000 port is already used with another service on your system then you will get an Empty reply from the Grafana server.
Also, if you have used some custom port then restart your server- sudo systemctl restart grafana-server
Step 7: Access web Dashboard
Now, open a local or remote computer browser that can access the server IP address or hostname machine where you have installed the Grafana server. And point it to http://your-server-ip-address:3000 If you are using a custom port then instead of 3000 use that.

Step 8: Default Grafana Password
By default, the username is admin and the password is also admin. As you log in to the system, it will ask you to set a new and strong password for the web interface login.
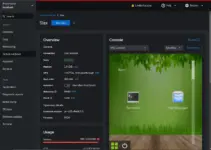
Step 9: Dashboard
Finally, here is the Dashboard, now select the data source and start creating panels to monitor data. For more info on it, you can refer to the official documentation.