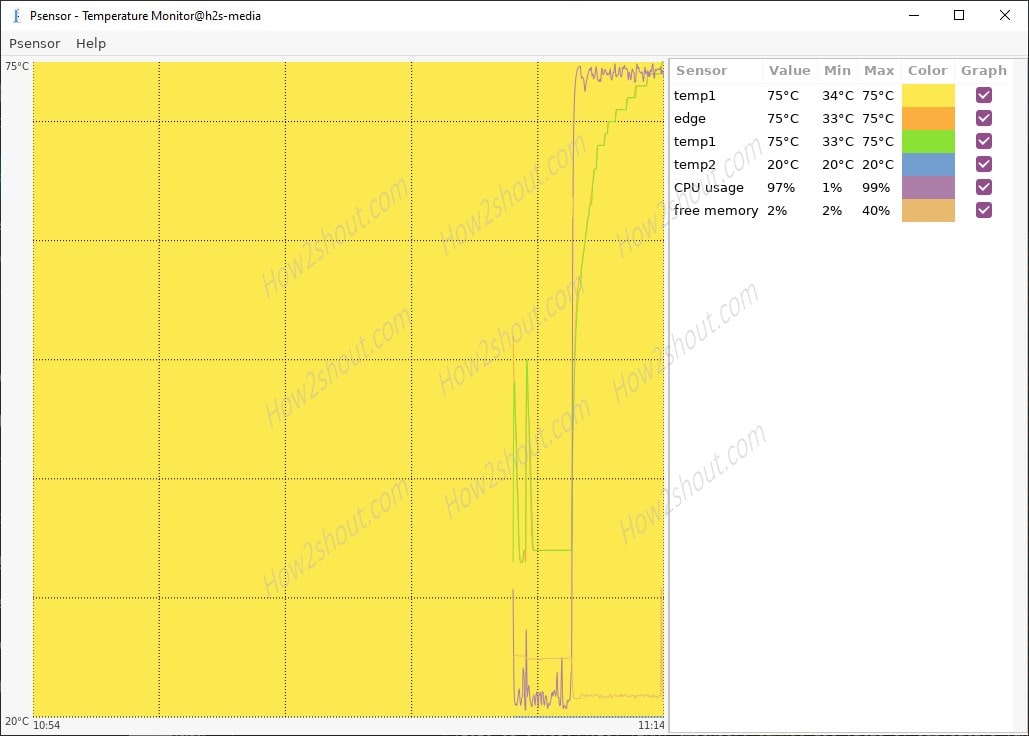
The Psensor is simple CPU temperature monitoring that uses the systems inbuilt sensors to pull the values and displays them on a graphical user interface. This graphical hardware temperature monitor for Linux various systems such as Ubuntu, Debian, Linux Mint, CentOS, RHEL, and more…
Whether you are troubleshooting your system, experimenting with overclocking or freshly assembled a new system with some selected components, you should keep an eye on the CPU temperature at least in the test phase.
Lm_sensors packages are available for almost all Linux distributions, reads the values of the temperature sensors via the System Management Bus (SmBUS); An included command-line tool queries the current temperatures.
However, lm_sensors only provide snapshots on the command line where for system monitoring, a GUI tool that logs the temperatures is more practical. And above that reporting in the graph would be the icing on the cake. Well, this can be done using an open-source tool called psensor, which serves as a front end and polls lm_sensors at definable intervals. The tool uses the values to draw a meaningful curve of the CPU temperature.
Psensor installation on various Linux distros
psensor is a very lightweight tool that can perform all key tasks very smoothly without much configuration effort. Also, it works perfectly with all desktop environments. On one hand, where lots of tools are available for Windows platforms to measure and show the hardware components temperature, Linux systems feel a secluded a little bit. However, Psensor fills a gap, especially on desktops that lack a reliable temperature display in the form of an applet or a shell extension.
What is psensor-server?
Furthermore, those want to monitor the remote server they can install psensor-server to fetch Remote Server Temperature and Fan Speed information or values directly on their local system.
Installation:
sudo apt install psensor-server
yum install psensor-server
Psensor Features:
- Graphs representation for Temperature.
- Show temp for all CPU cores.
- Motherboard, GPU (NVidia GPUs using XNVCtrl) and Hard drives sensors supported as well.
- Psensor can show the speed of the system fan.
- Display Current Usage of Processor.
- Easy to install and handle.
- Logs generation
- It can trigger notifications for the user when system hardware crosses the acceptable threshold temperature or have any Fan related issues.
- Colorful representation for each CPU core.
What does it require to work?
Psensor graphical hardware temperature monitor for Linux uses two packages to check the hardware temperature of PC or laptop that are lm-sensor and hddtemp. These packages also help in generating the Fan speed values.
Installation on Ubuntu 20.04 LTs or 18.04/16.04, Debian, Linux Mint
Ubuntu has included psensor in the standard package repository since version 11.10, therefore doesn’t need any third-party repository at all. This is also true for Ubuntu 16.04, Debian, Linux Mint, Elementary OS, MX Linux, Zorin, etc.
Apart from it, we can install the lm-sensors package with apt-get or via the software center without any extra efforts. This can also install hddtemp, which query the hard disk temperature. Setting up the hddtemp daemon is optional: If you only want to keep an eye on the CPU, you can leave the configuration of hddtemp.
Here is the command to install Psensor on all Debian or Ubuntu-based Linux distros:
sudo apt-get install lm-sensors hddtemp psensor
On CentOS or RHEL 6/7/8
On Redhat or for its downstream CentOS, this application is available through EPEL repository, thus enable that if you haven’t and then install this Linux temperature monitoring tool.
yum install epel-release lm_sensors lm_sensors-devel hddtemp
For some other distributions, such as OpenSuse suitable packages are available via the Build Service. Go to the official package available on OpenSuse for this tool, here is the link. Now, select the version of your system and select the “Click Install” button or Download it for manual installation.
For Fedora 16/17 the unofficial repository “rpm-sphere” provides packages for 32- and 64-bit systems, which can also be downloaded and installed individually via pkgs.org.
The source code of the stable and the developer version is available on the project website; the dependencies for compiling on Debian-like systems are documented in the README file that is available when you extract to compile it. The required tool lm_sensors is also included in the package sources of the common Linux distributions and can be installed quickly via the package manager.
If you want to compile Psensor on RPM-based Linux OS or RedHat based, then you can use the below commands:
yum install gcc gtk3-devel GConf2-devel cppcheck libatasmart-devel libcurl-devel json-c-devel libmicrohttpd-devel help2man libnotify-devel libgtop2-devel make
- Go to official website files page: http://wpitchoune.net/psensor/files
- Download the latest package of Psensor available in the tarball archive.
- Switch to Downloads Directory
- Extract the file with the command:
tar zxvf psensor-*.tar.gz
cd psensor-*/
./configure
sudo apt install make
make
make install
- Start the sensor detection script: +sensors-detect+ and follows the instructions.
- Reboot or activate the kernel modules which have been found.
- Run:
psensor
Set up sensors
Psensor relies on lm_sensors to determine the temperature. In some current distributions, the standard configuration of lm_sensors is sufficient to display the temperature of the CPU and chipset. If, on the other hand, psensor does not output anything or important values are missing, lm_sensors must first be configured.
For that we run a command:
sudo sensors-detect
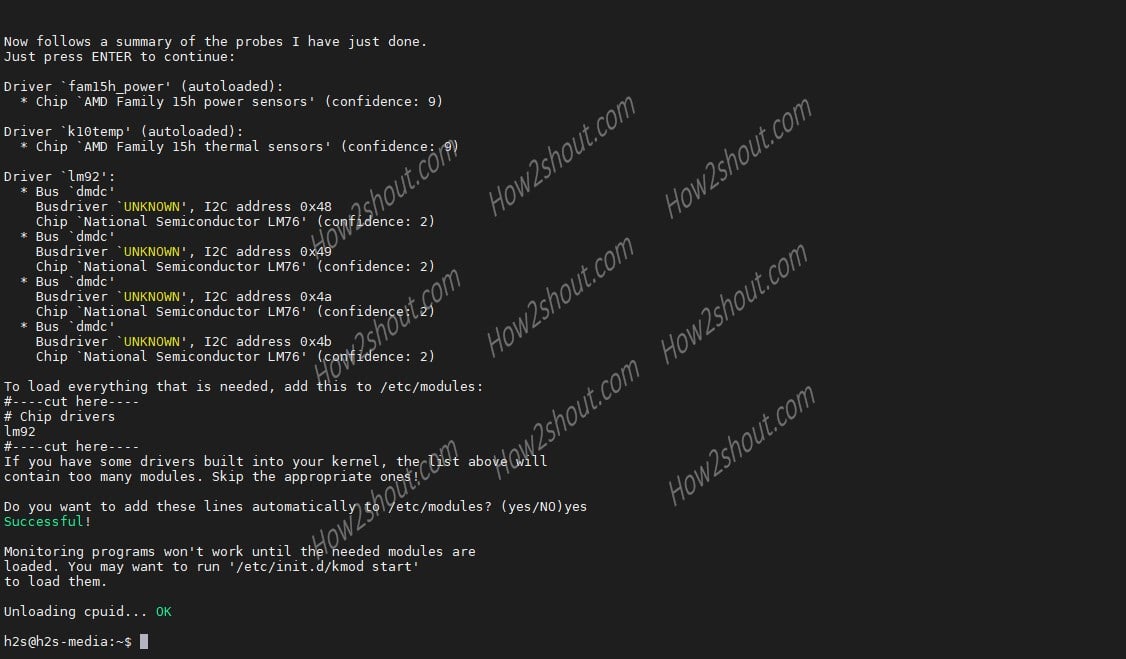
This is configuration script sensors-detect will configure the lm_sensors. It will create a new configuration file /etc/sensors3.conf and also checks the chipset, CPU, memory controller, I / O ports, and graphics adapter one after the other for known sensor chips for which it supports gives by asking you some questions about your system hardware during setup.
Well, on each question you should confirm it by typing “yes“. The installation then writes the configuration file and loads the associated kernel module i2c-dev. A list of supported chipsets is provided by the source code of lm_sensors in the SUMMARY file in the /doc/chips directory.
Example:
Your Hardware Enablement Stack (HWE) is supported until April 2025.

The programs included with the Ubuntu system are free software;
the exact distribution terms for each program are described in the
individual files in /usr/share/doc/*/copyright.

Ubuntu comes with ABSOLUTELY NO WARRANTY, to the extent permitted by
applicable law.

/usr/bin/xauth: file /home/h2s/.Xauthority does not exist
h2s@h2s-media:~$ sudo sensors-detect
[sudo] password for h2s:
# sensors-detect version 3.6.0
# System: HP HP Notebook [Type1ProductConfigId] (laptop)
# Board: HP 81FA
# Kernel: 5.4.0-26-generic x86_64
# Processor: AMD A10-9600P RADEON R5, 10 COMPUTE CORES 4C+6G (21/101/1)

This program will help you determine which kernel modules you need
to load to use lm_sensors most effectively. It is generally safe
and recommended to accept the default answers to all questions,
unless you know what you're doing.

Some south bridges, CPUs or memory controllers contain embedded sensors.
Do you want to scan for them? This is totally safe. (YES/no): YES
Module cpuid loaded successfully.
To check everything is working fine, run:
sensors
This will show you the various temperature values straight on your command terminal interface. The command sensors in the terminal provide comparative values that can be used to find out whether temperature reading is working correctly. Ideally, the command outputs all the sensors that are detected, including processor and chipset temperature, CPU voltage, and fan speed. The section that begins with “coretemp-” is relevant for the CPU temperature. The temperatures of the individual CPU cores are listed here. Many multi-core CPUs such as Intel Core i3 / 5/7/9 models reflect the temperature of the entire processor with the value “Physical id 0”.
Run Psensor GUI Linux APP to Show temperature
The running of the Psensor after the installation is very easy, either go to Applications of your respective Linux OS find the icon and start it or just on the command terminal type: psensor
The psensor program also starts an indicator in the panel on the Unity desktop, whereas, under Cinnamon, GNOME, and other desktops, it shows up with a panel icon after the start.
When you click on this indicator it will show all the current temp values of CPU and Hardisk including Fan speed and “Sensor Preferences” option.
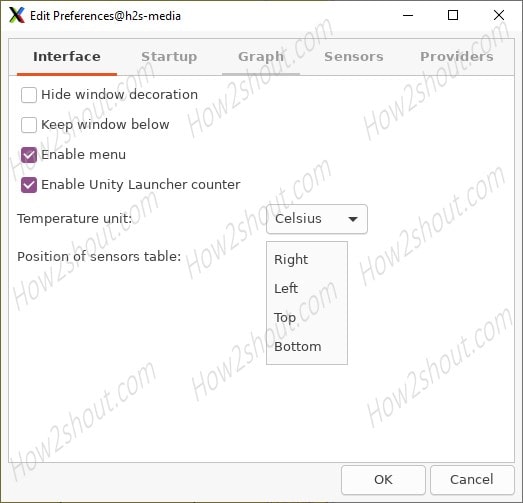
Psensor Interface
The position of the graph on the interface of this can be adjusted as per your preference such as to right, left, top, and bottom. To Hide Windows Psensor windows decorations, mean minimize, maximize and close button can be hidden from here including Menu, and Ubuntu launcher counter.
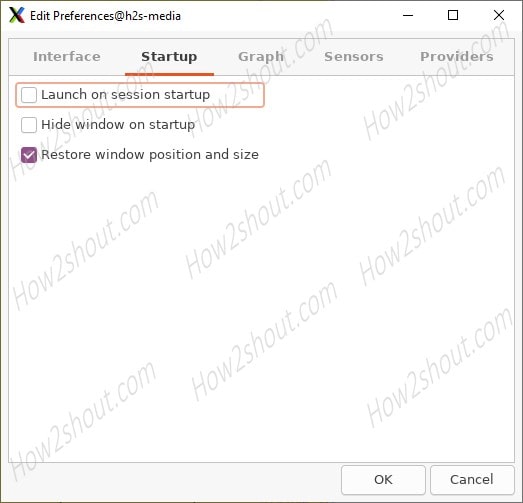
Startup
To automatically launch the Psensor with session start, the “Launch on session startup” settings can be marked.
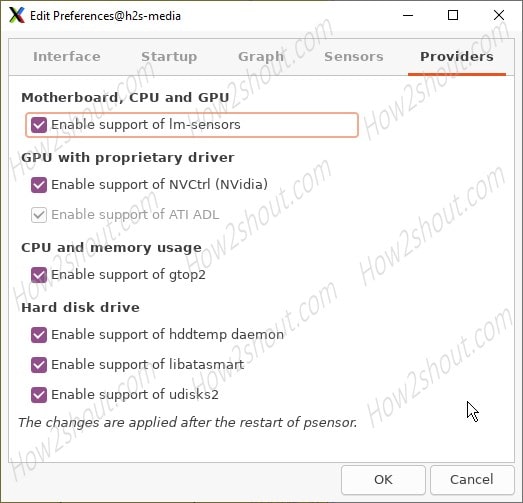
Providers
This section provides control over enabling and disabling the support for different sensors. Such as Mother, CPU, and GPU; Nvidia, CPU, and Memory Usage via gtop2 and hard disk with the help fo hddtemp daemon, libatasmart, and udisk2.
Measurement interval setting
In the standard settings, however, the measurement interval is too short, so that the graph tends to jump suddenly on the temperature scale.
A measurement interval of four seconds or more ensures a more meaningful graph. So, to adjust that, click on Psensor ⇒Preferences ⇒ Sensors Tab and then set the interval around 4 seconds that will ensure a quieter and more meaningful graph.
Moreover, already during installation, psensor is set up as an autostart program in the session management, with gnome-session-properties you can undo this if necessary.
Sensor Preferences
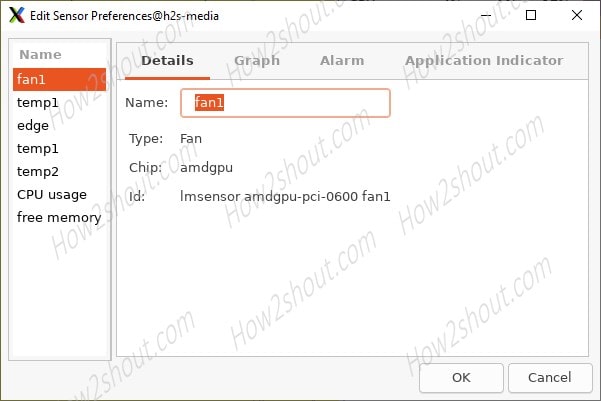
We can change the default name assigned to sensors by this Linux temp. monitoring application to something which can be easily recognized. This facility is available under menu Psensor->sensor prefernces->Details.
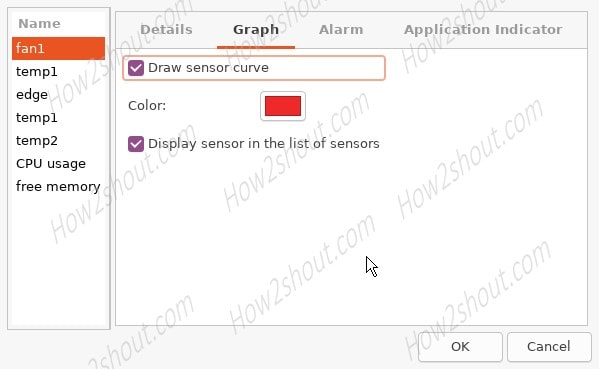
Graph tab to offer custom Psensor graph colors and ability to hide or show Display sensors list and curve drawing.
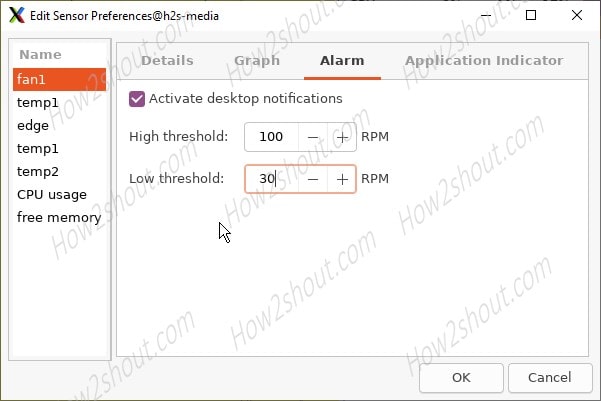
Alarm to send notification on the specified threshold for the fan, temperature, CPU usage, Memor and more.
Uninstall Psensor
In case you want to remove it but the lm-sensors package then run:
sudo apt remove psensor
yum remove psensor
So, this was a glimpse of Psensor using lm_sernsors package that generally delivers reliable values for a typical PC or laptop hardware. It really helps to easily measure the different temperatures of the system components to know, is our system overheating or not during overclocking, gaming, or strenuous tasks?
