Install pgfplots in your Ubuntu 20.04 or 22.04 Linux to use it in LaTeX for creating normal/logarithmic plots in two and three dimensions.
As we know pgfplots is quite a useful package for those who deal in LaTeX because it enables users for creating high-quality, customizable plots directly within the documents. Therefore, whether you need a simple graph or complex visualizations, pgfplots offers a wide range of features to meet the demands.
Here in this tutorial, we will see the step-by-step process of installing pgfplots on an Ubuntu system.
Step 1: Update Ubuntu Package List
It is important to run the system update command before installing the PgfPlots package, so on your command terminal run the given command.
sudo apt updateStep 2: Install TeX on Ubuntu
To use pgfplots we need to have TeX Live distribution that offers all the packages required to create documents in LaTeX. So, if you already have that then can skip this step to jump to Step 3 of this tutorial.
Whereas those who don’t have it can install TeXLive which includes all the essential packages and tools for LaTeX document creation.
sudo apt install texliveStep 3: Install pgfplots on Ubuntu 22.04 or 20.04
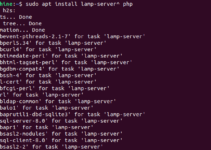
There are some extra packages like pgfplots that are required and not included within the basic installation of TeX Live. So, to get the additional packages required for LaTeX, install texlive-latex-extra:
sudo apt install texlive-latex-extraStep 4: Verify Installation
After completing the above given steps we can check whether pgfplots is correctly installed by running the given command.
kpsewhich pgfplots.styIt will display the path to the pgfplots.sty file on the terminal.

Step 5: Using pgfplots in LaTeX Documents
To make use of pgfplots in a LaTeX document, we need to include the package at the beginning of our document, for example:
Let’s create a Tex file, named – mypfg.tex, you can create it with whatever name you want to give.
After that add the following code in which we are using pdfplots to create a simple parabolic plot.
\documentclass{article}
\usepackage{pgfplots}

\begin{document}

\begin{tikzpicture}
  \begin{axis}[
    xlabel={$x$},
    ylabel={$f(x)$},
    title={Plot of $f(x) = x^2$},
    ]
    \addplot[domain=-2:2, samples=100, blue]{x^2};
  \end{axis}
\end{tikzpicture}

\end{document}
Save the file by pressing Ctrl+X, type ‘Y’, and hit the Enter key.
Step 6: Compilation
Compile the created TeX file using the given command:
pdflatex your-file.texFor example, here our file name is mypfg.tex, then the command will be like this:
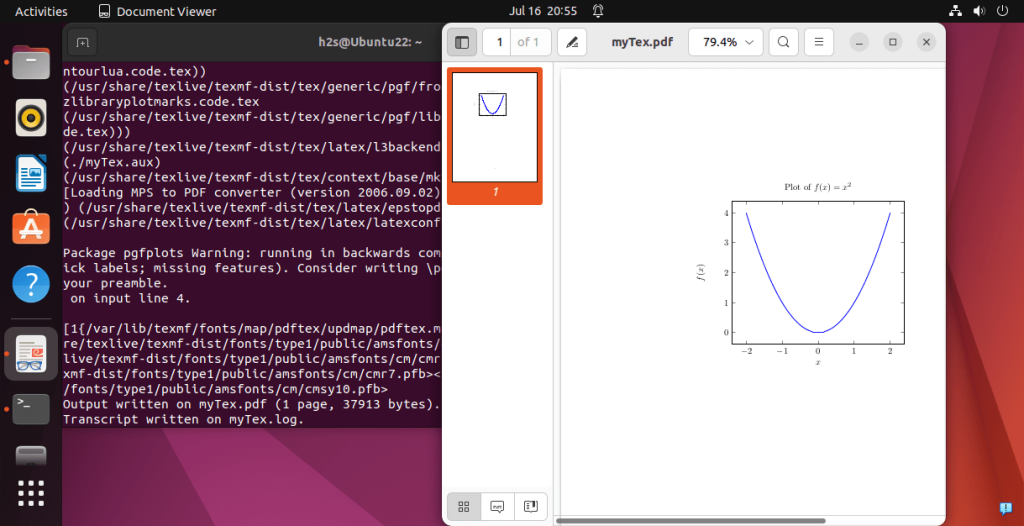
pdflatex mypfg.texThe output of the compiled file will be saved in a PDF format or with a pdf extension using your TeX file name. As we have here a PDF file of our compiled code as mypfg.pdf. It will contain a simple parabolic plot of the function $f(x) = x^2$.
Well, in the above code, we’ve used the pgfplots package to create a plot of the function $f(x) = x^2$. The tikzpicture environment is used to draw the plot, and the axis environment sets up the coordinate system for the plot. The xlabel, ylabel, and title options are used to label the axes and give a title to the plot. The \addplot command is used to plot the function over the specified domain with the specified number of samples.
Here is the output we got:
With pgfplots included in your LaTeX document, you can now create plots, charts, and graphs within your text.
Conclusion
So, this was the simple way to install pfgplots for Ubuntu, Debian, or any other Linux you are using with TeX Live for creating TeX documents. It helps you in creating data-rich plots for your academic, scientific, and technical publications, as well as presentations and reports.