Netdata is a free web-based real-time monitoring solution available to install on Linux servers to monitor their performance and resource consumption locally or remotely. It is very easy to set up, the latest version can be installed with just a command on all popular Linux systems including Ubuntu 20.04/18.04, CentOS 7/8, RHEL, OpenSUSE, Debian, Linux Mint, and more…
- CPU (usage, frequencies, status, cores, etc.)
- Hard drives (space, type, operations, backlog, etc.)
- Memory (total available, using the kernel, NUMA, etc.)
- Network interfaces (bandwidth, errors, packets, etc.)
- IPv4 and IPv6 addresses (including errors, packets, connections, multicast)
- Cross-process communication or IPC
- Linux DDoS protection (SYNPROXY process metrics)
- Firewall
- SNMP devices
- Hardware sensors (including voltage, temperature, fan)
- Linux control groups
- Applications (use of resources, status, etc.)
- Use and configuration of Tomcat, Apache, MySQL, etc.
- Report generator
- Status of the Nginx web servers
- Users and groups (use of resources, writing to disk, use of SWAP memory, etc.)
- Analysis of ao DNS, OpenVPN, DHCP.
Installation of Netdata on Linux to monitor server
Open the command terminal and simply paste the given script to install NetData on your Linux such as Ubuntu 20.04, CentOS 7/8, and others… You can also use it for Windows 10 WSL.
bash <(curl -Ss https://my-netdata.io/kickstart.sh)
It will ask your permission to download and install packages, so allow that and once the installation is completed, open a browser on your local or remote system that can access the Server or Desktop where Netdata has been installed.
In the URL bar type the server-IP-address along with port number 19999. For example, our IP address of the server was 192.168.189.163, thus to access Netdata Dashboard, the URL will be like this – https://192.168.189.163:19999 or http://127.0.0.1:19999 (only for the same system where you have netdata).
Dashboard
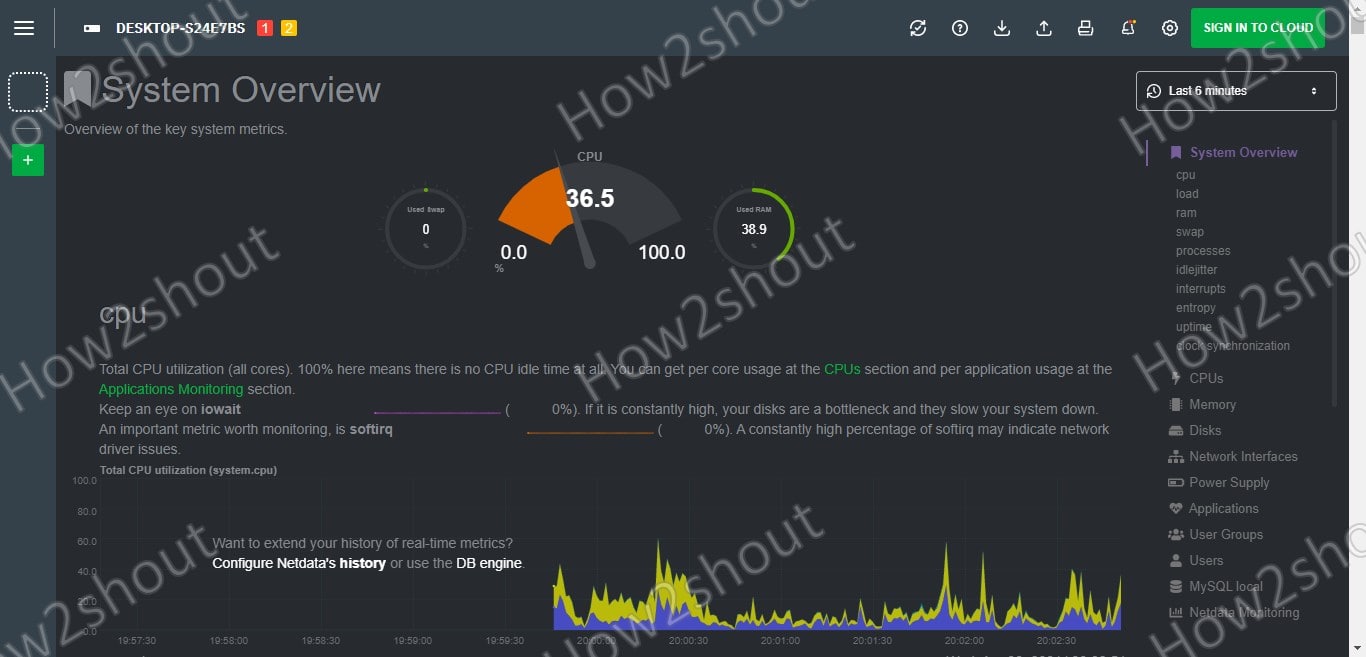
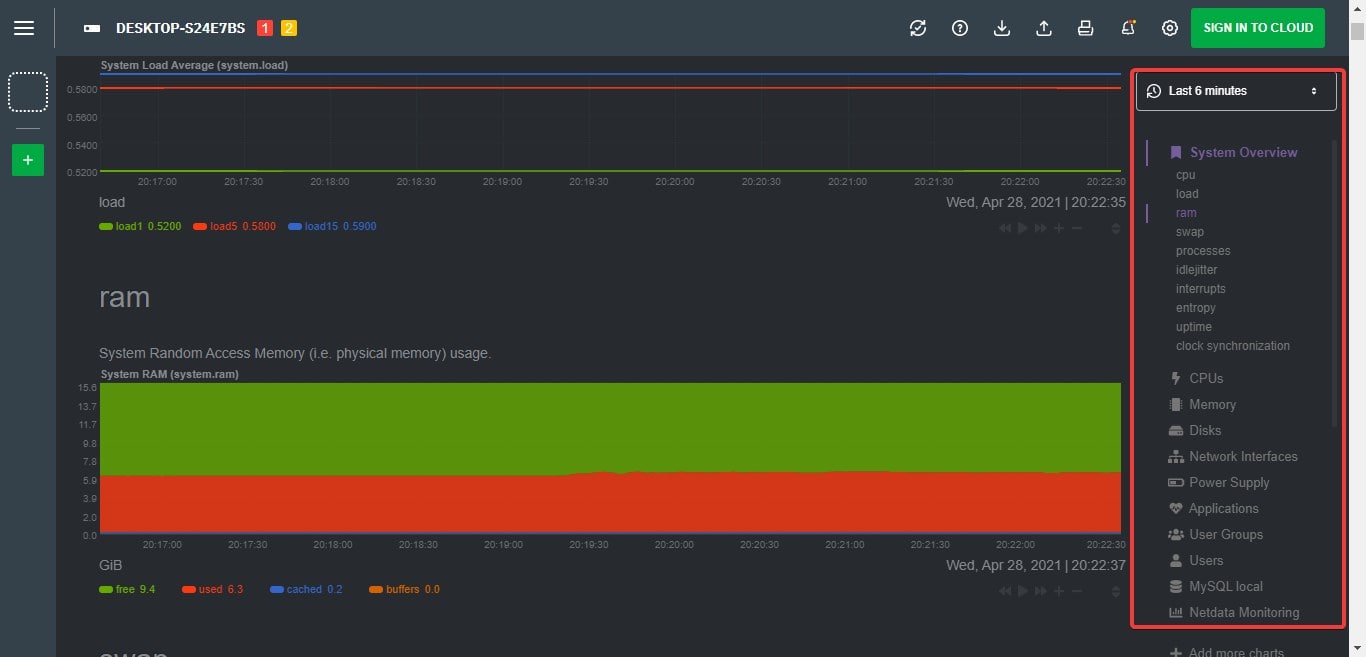
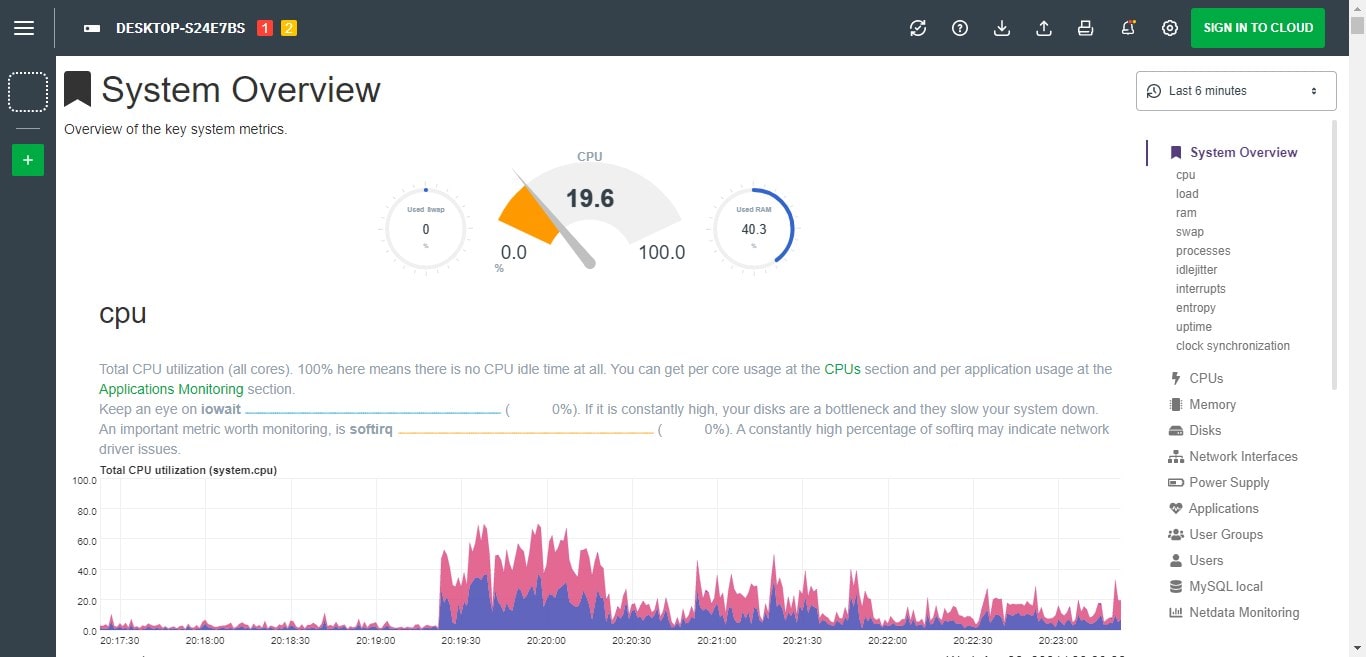
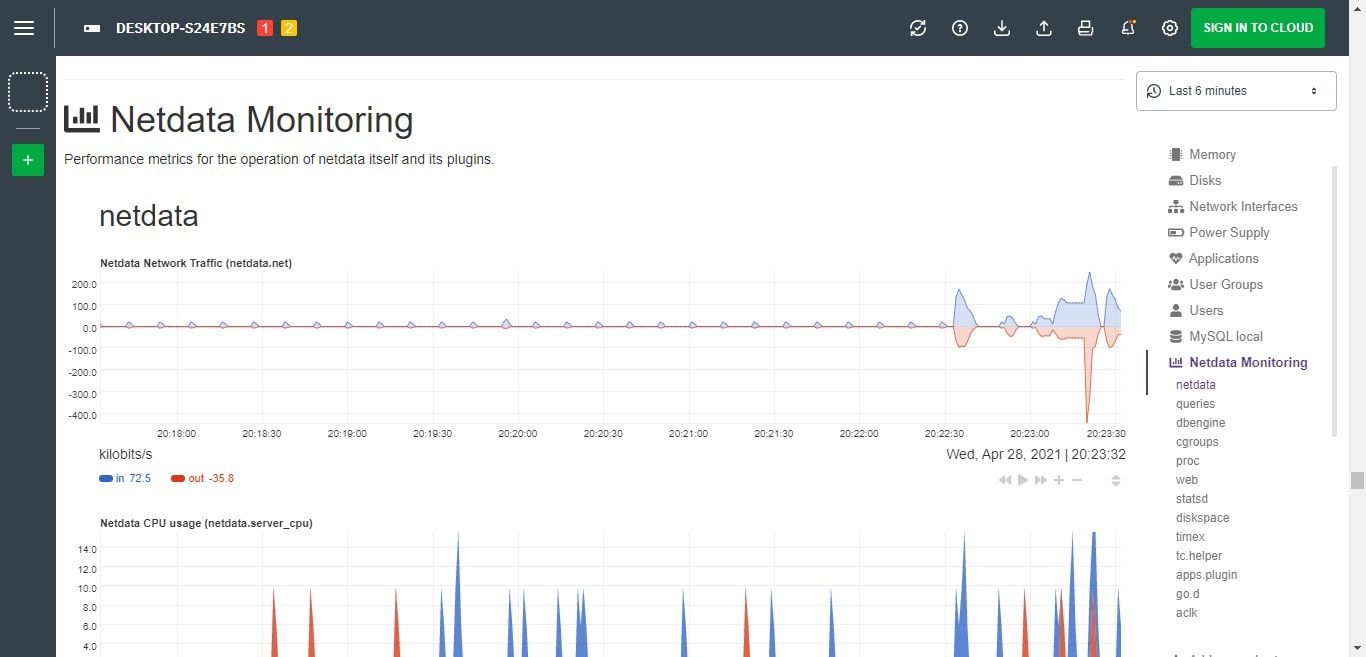
You will have the Dashboard of Netdata, there is no need to set up it any further, it will show all the information it can extract from the system right on the web-based Dashboard in your browser. To view the consumption of various resources individually, the user can jump directly to the individual overviews via the sidebar.
You can move the graphs using drag & drop, or you can enlarge sections by holding down the shift key. On smartphones and tablets, small screens Pinch & Zoom gestures work for a close view of generated data.
Light Theme mode
Uninstall Netdata
There is a script available on this Linux server monitoring platform’s GitHub page, so to remove Netdata installation from our system, just download and execute that.
wget https://raw.githubusercontent.com/netdata/netdata/master/packaging/installer/netdata-uninstaller.sh
Change the permission of script to make it executable-
chmod +x ./netdata-uninstaller.sh
Finally, run it to completely remove the installation-
sudo ./netdata-uninstaller.sh --yes --env /etc/netdata/.environment
Closing thoughts:
Netdata is a very compact designed monitoring system that is available in both free and paid plains. Moreover, the user can go for Netdata cloud to centralized all system monitoring by simply installing its agent on all the nodes that need to be monitored. Overall, this platform is really well thought out and very well easy to implement without the need for root users. As there is no need to set up a web server, databases, or any configurations, Netdata is once a setup and forget solution for system monitoring.
